
Analyses · United States & China
US and Chinese data centres use almost six times Switzerland's electricity
Data centres in the United States and China used 341 TWh of electricity in 2025, almost six times what Switzerland uses in a whole year. We mapped where the largest cloud hubs are in both countries, and looked at how much more power they are expected to need by 2030.
Six Switzerlands of electricity
Switzerland used 58 TWh of electricity in 2025. Data centres in the United States used 224 TWh, almost four times as much, and those in China 117 TWh, about twice as much. Together that is 341 TWh.

TWh in 2025. Data centres include cooling and all workloads, not AI alone. IEA estimates; Swiss final electricity consumption.
Where the biggest hubs are
Synergy Research ranks the world's large cloud (hyperscale) data-centre markets by capacity. The top 20 hold about 60% of global capacity, and Northern Virginia and Greater Beijing alone hold 17%. Fifteen of the 20 are in the United States, three are in China.
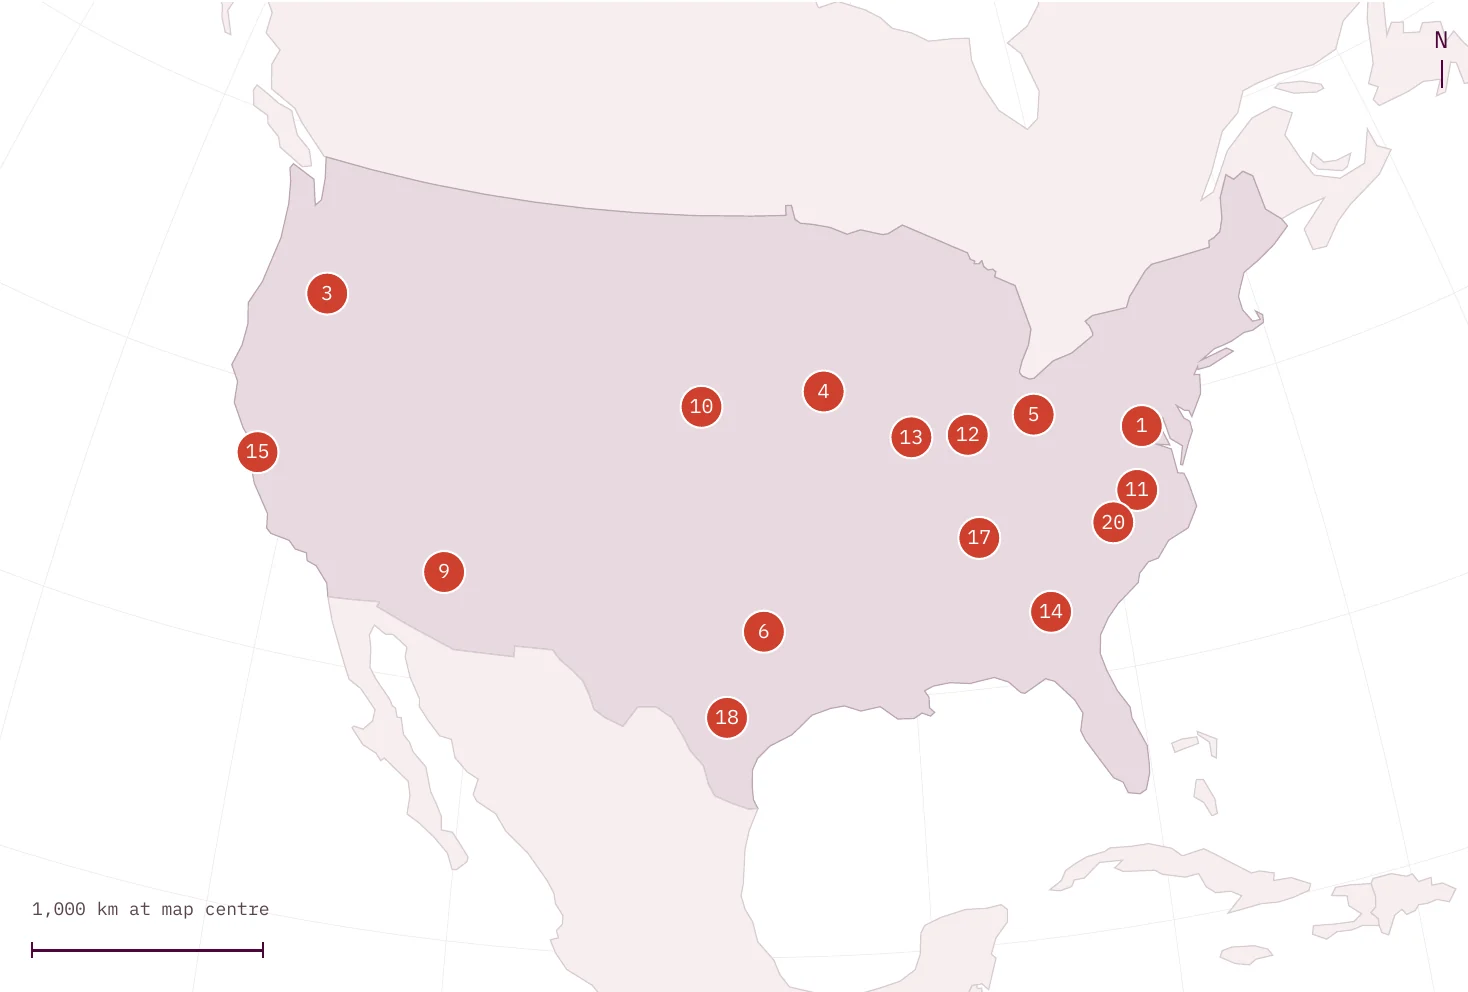
- #1 Northern Virginia
- #3 Oregon
- #4 Iowa
- #5 Ohio
- #6 Dallas
- #9 Arizona
- #10 Nebraska
- #11 Southern Virginia
- #12 Indiana
- #13 Illinois
- #14 Georgia
- #15 Silicon Valley
- #17 Tennessee
- #18 San Antonio
- #20 North Carolina
In the US the hubs reach far beyond the coasts: Iowa, Nebraska, Ohio, Indiana and Tennessee are all in the global top 20. In China, all three sit in the developed east, close to the largest cities.
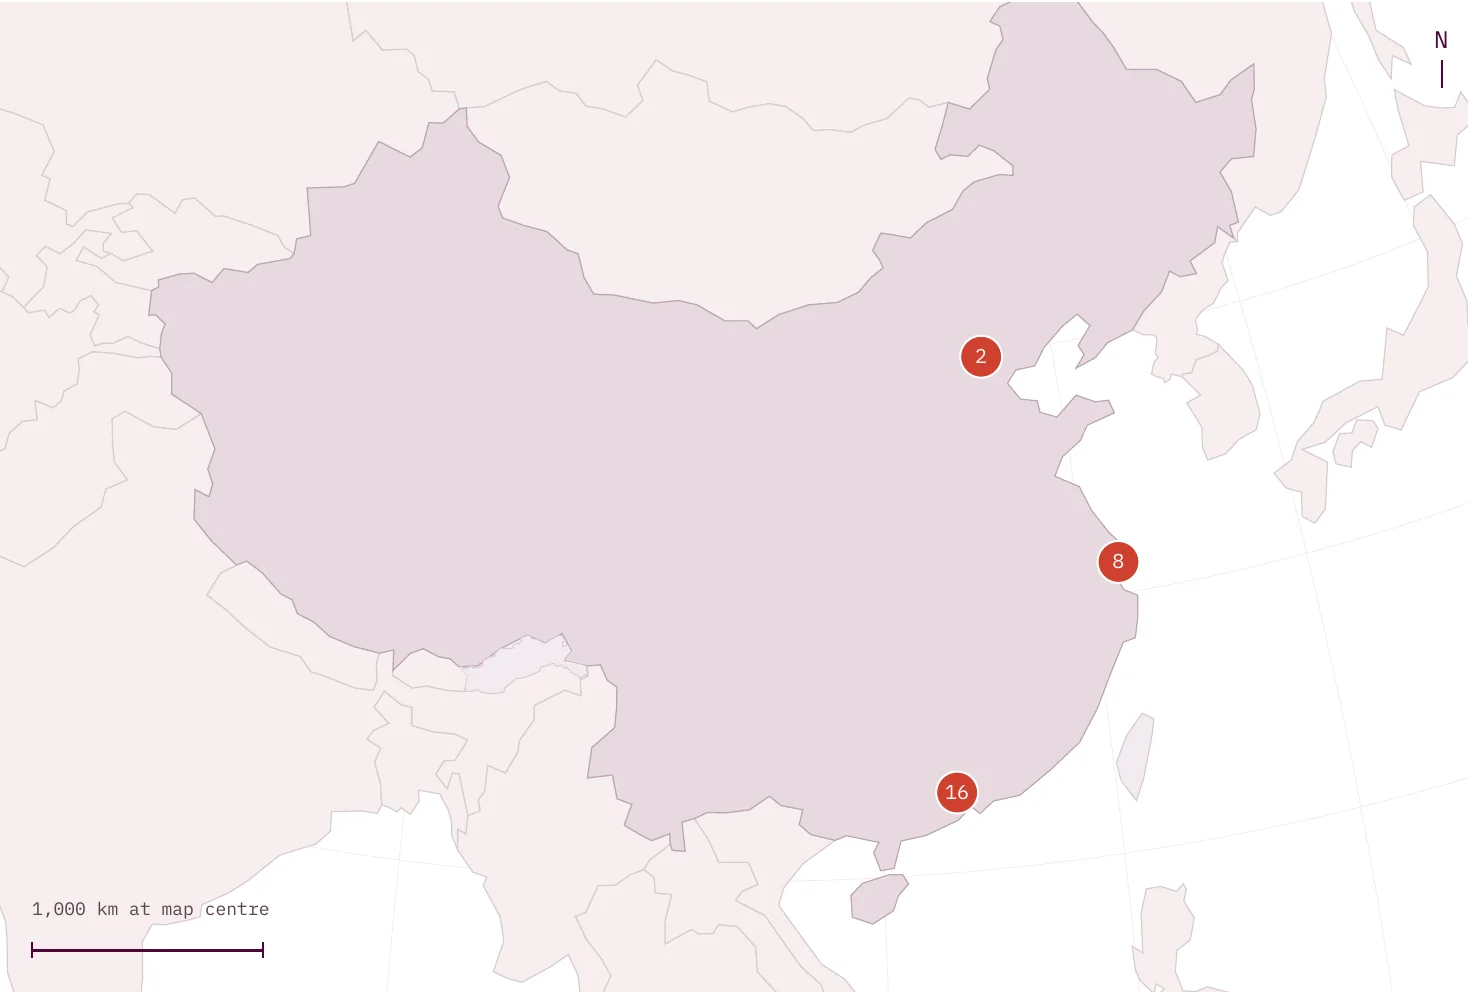
- #2 Greater Beijing
- #8 Shanghai
- #16 Guangdong
Markers show regional locations, not individual buildings. Electricity totals cover all data centres in each country.
Demand keeps rising in both countries
In the IEA's base case, data-centre electricity use in the United States grows from 224 TWh in 2025 to 426 TWh in 2030, an increase of 90%. China grows faster from a lower base, from 117 to 277 TWh, or 137%.
TWh per year. 2030 values are IEA Base Case projections, not realised consumption.
The next question is local
A national total says how much power the sector needs. Whether the next wave of data centres can actually be built depends on what is within reach of a specific site. For a location assessment, the next step is to overlay the hubs, or a list of candidate sites, with the infrastructure that could support them:
- Power: grid access and available capacity.
- Connectivity: fibre routes and network access.
- Land and water: space to build, and cooling constraints.
Mapped together, these layers show which constraint binds first at each site, and where the next campus is realistic.
Sources and notes
- Electricity: IEA, Key Questions on Energy and AI (2026), Table A.4. All data centres including cooling, not AI alone. 2025 estimates; 2030 IEA Base Case. Growth rates calculated from the IEA values.
- Switzerland: Swiss Federal Office of Energy (2026), final electricity consumption 2025, 58.0 TWh.
- Hubs: Synergy Research Group, ranking of hyperscale data-centre markets by capacity, Q1 2026 data (published August 2026).
- Maps: Natural Earth. Markers show representative locations of the top-ranked markets.
Planning where to build?
We map power, connectivity, land and water around candidate sites, for data centres or any infrastructure that depends on location, anywhere in the world.